Predicting the Dynamometer Card of a Rod Pump

Prof. Chaodong Tan (China University of Petroleum), Guisheng Li (Plant No. 5 of Petrochina Dagang Oilfield Company), Yingjun Qu (Plant No. 6 of Petrochina Changqing Oilfield Company), Xuefeng Yan, (Beijing Yadan Petroleum Technology Co., Ltd.), Dr. Patrick Bangert (algorithmica technologies GmbH)
A rod pump is a simple device that is used the world over to pump for oil on land, see figures 1 and 2. Basically, we drill a hole into the ground and cement the hole (with a well casing) so that a nice vertical cavity results. Into this cavity a rod is inserted that is going to move up and down using a mechanical device that is called the rod pump. Attached to the bottom of the rod is a plunger that is a cylindrical "bottle" used to transport the oil. On the downward stroke, the plunger is allowed to be filled with oil, and on the upward stroke this oil is transported to the top where it is extracted and put into barrels.
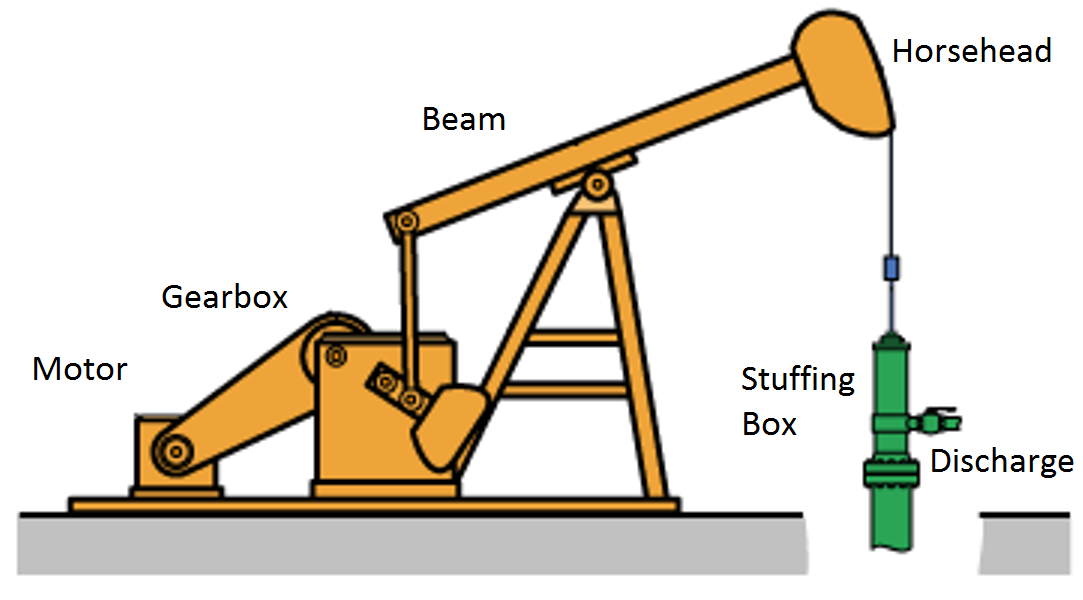
Figure 1: A schematic of a rod pump. The motor drives the gearbox, which causes the beam to tilt. This drives the horsehead up and down. This assembly assures that the rotating motion of the motor is converted into a linear up-down movement of the rod. The stuffing box contains the oil that is discharged through a valve on the top of the well.
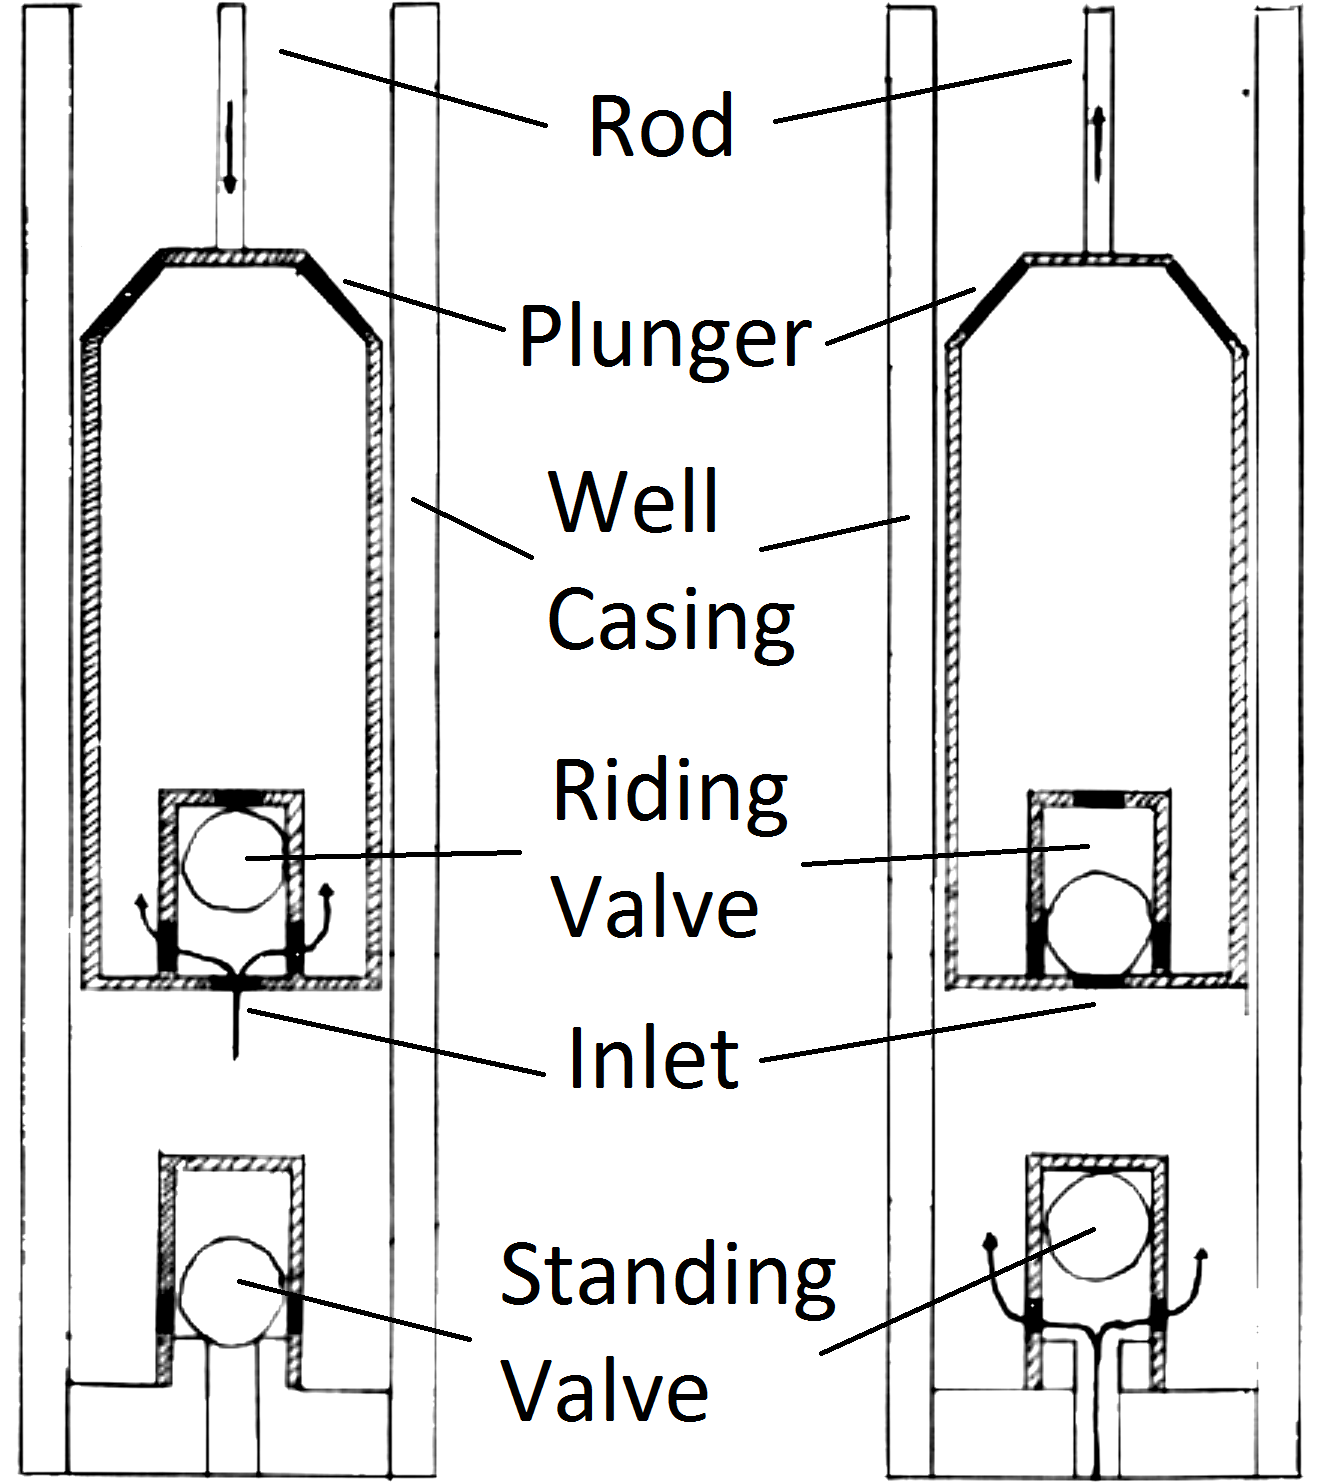
Figure 2: A schematic of the well bottom. The rod drives the plunger down into the well guided by the well casing. The bottom of the plunger has a so-called riding valve to take in the oil through the inlets. The bottom of the well is closed off to the reservoir with a so-called standing valve that opens once the plunger is at the bottom.
Let us focus our attention on two variables of this assembly: the displacement of the rod as measured from its topmost position and the tension force in the rod. When we graph these two variables against each other such that the displacement goes on the horizontal and the tension on the vertical axis, we will find that, as the system is in cyclic motion, the curve is a closed locus. This is called the dynamometer card of the rod pump, see figure 3 (01) for an example of expected operations. To travel once around the locus takes the same amount of time as it takes the rod pump to complete one full cycle of downstroke and upstroke. A normal rod pump makes four strokes per minute.It is a remarkable observation that the shape of this locus allows us to diagnose any important problem with the rod pump [1]. In figure 3 we display dynamometer card examples for the most common problems.
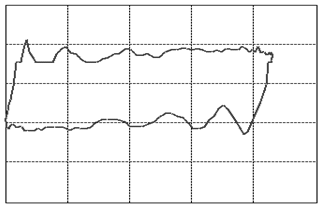
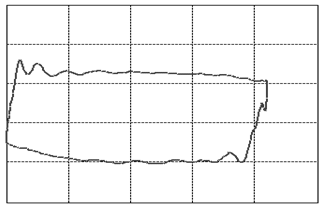
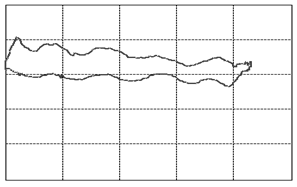
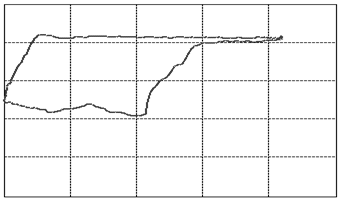
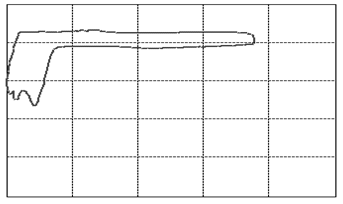
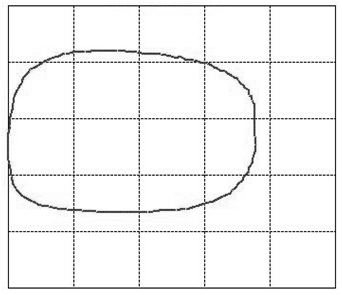
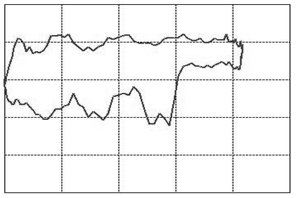
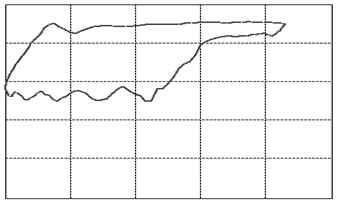
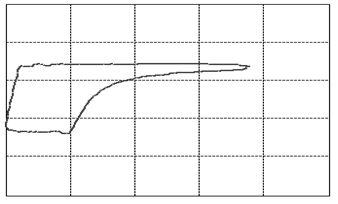
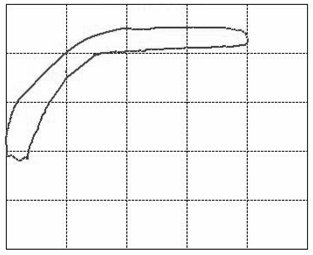
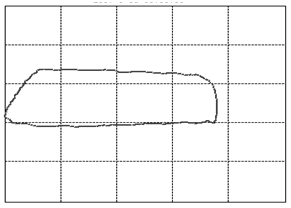
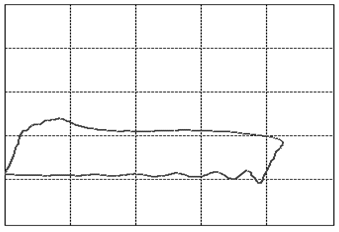
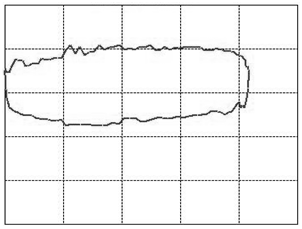
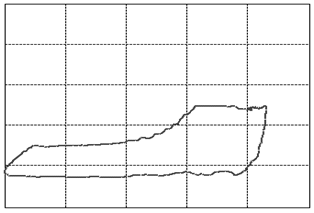
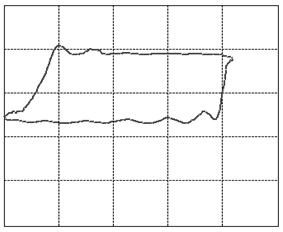
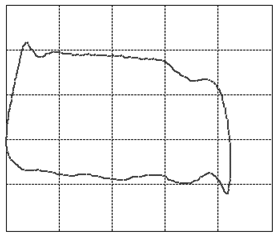
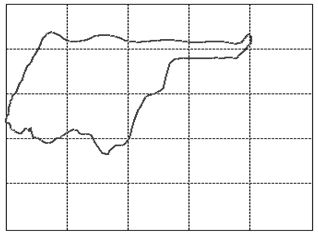
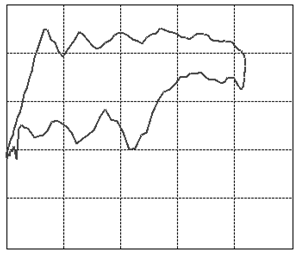
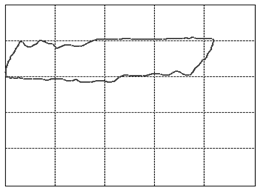
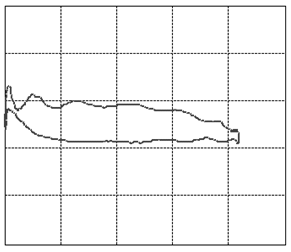
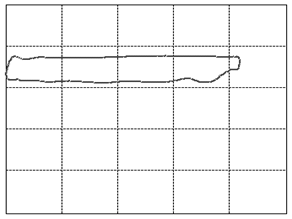
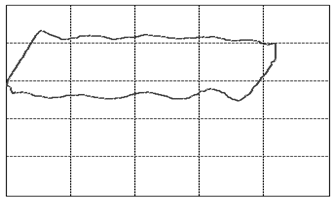
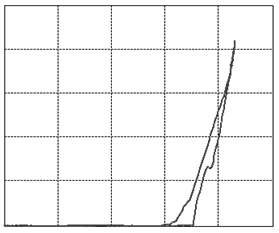
Figure 3: The various cases of dynamometer cards. See text below (points 1-23) for an explanation.
We will go into a little detail on these shapes and their respective problems because it is an exceptional fact that a complete diagnosis can be made so readily from a single image. This approach should be possible for a variety of other machines once only the correct measurements and the correct way of presenting them are identified. That is the deeper reason behind presenting these here. It should be encouraged to seek a similar presentation of faults in other machinery.The interpretations of the 23 images in figure 3are as follows:
It can easily be seen that the diagnosis of problems is immediate from the shape given a little experience in the matter. In fact, it has been shown that the diagnosis can be automated by recognizing the shape with a perception neural network [2].
Our purpose here is to investigate whether we can predict the future shape of the dynamometer card and thus diagnose a situation today that will lead to a problem in the next few days. A card usually consists of 144 observations of the displacement and the tension. We first transform this data into shape information by fitting a geometrical prototype to each card. This prototype has only 7 free parameters. Thus, the shape of a card is characterized by 7 parameters. Figure 4 demonstrates this fit in six examples over the time evolution of a particular rod pump.
These shape parameters can now be used as the basis for a prediction of future shapes. Using a recurrent neural network [4], we use some history to create an evolutionary model (figure 4, images (1) to (2)) and then let this model predict the future (figure 4, images (3) to (5)) with image (3) representing the present moment. As the prediction agrees quite well with the measurement, we have demonstrated that this approach can indeed predict future problems with dynamometer cards that call for the operator’s attention and maintenance. Note that the problem in image (5) and the moment at which the prediction is made are separated by 4000 pump cycles or about 16.7 hours. This is enough warning time for practical maintenance to react.
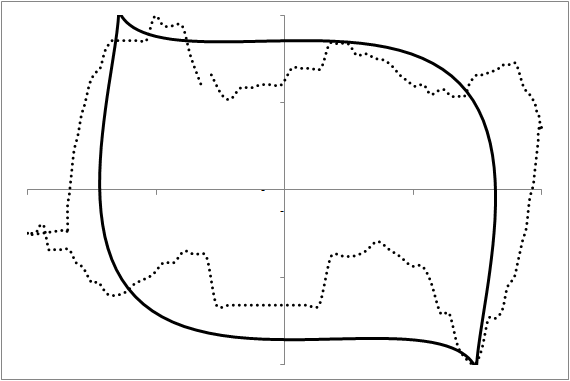
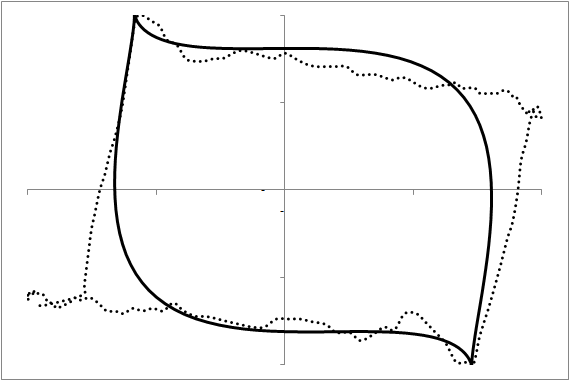
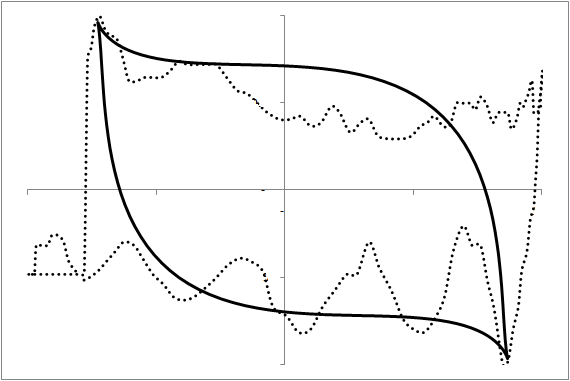
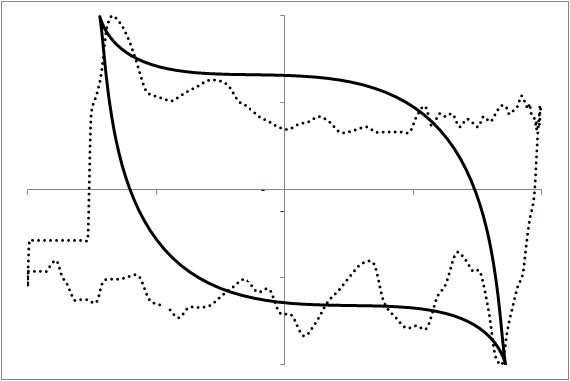
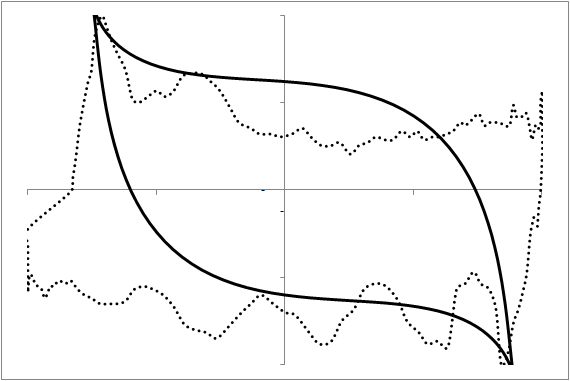
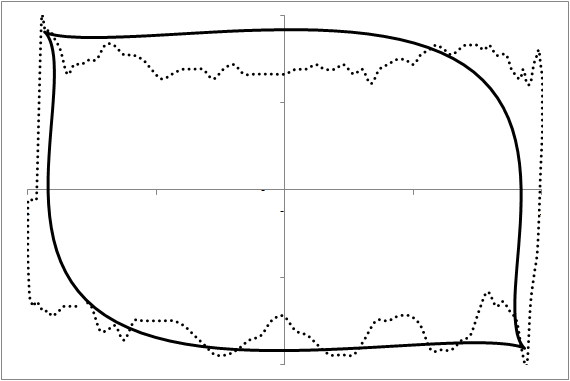
Figure 4: The modeling of a dynamometer card's evolution in time. Each card was measured 2000 pump cycles (about 8.3 hours) after the previous image. Images (1) and (2) at the top are historical data providing the model with the initial data. Using this, the model predicts images (3) to (5) and indicates that at image (5) we have a problem requiring attention. The maintenance measure is performed and we observe, see image (6), the establishment of operations as they should be.
In conclusion, we note that a recurrent neural network can reliably predict a future fault of a rod pump system via predicting the future model parameters of a mathematical formulation of the dynamometer card. In this example, the prediction could be made 16.7 hours in advance of the problem.


