Smart Condition Monitoring Using Machine Learning
Dr. Patrick Bangert
algorithmica technologies GmbH
Condition Monitoring usually analyzes each measurement separately using static limit information. This results in false alarms and unhealthy conditions that are not alarmed. Using machine learning techniques, the big data gathered around large equipment or an entire plant can be analyzed as a single coherent whole to draw conclusions about its current state of health. First, a mathematical model of the relevant measurement is created using the other measurements available. This model represents the equipment or plant as a unit when it is operating as it should. Second, this expected value is compared to the measured value. If they agree, the current state is healthy. If they do not, an alarm is released and a maintenance activity must follow. This method is seen to be far more successful than standard condition monitoring thus preventing false alarms and always alarming unhealthy states.
Any machine will eventually reach a point of poor health. That point is not a point of shutdown or failure yet but it is a point at which it is apparent that the machine no longer acts entirely as it should and will be in need of some maintenance activity to restore its full operating potential. Whether the machine is a rotating machine (pump, compressor, gas or steam turbine, etc.) or a non-rotating machine (heat exchanger, distillation column, valve, etc.) we ask: Is it currently healthy? That is the domain of condition monitoring.
The most common way to perform condition monitoring is to look at each sensor measurement from the machine and to impose a minimum and maximum value limit on it. If the current value is within the bounds, then the machine is healthy. If the current value is outside the bounds, then the machine is unhealthy and an alarm is sent.
This procedure is known to send a large number of false alarms, that is alarms for situations that are actually healthy states for the machine. There are also missing alarms, that is situations that are problematic but are not alarmed. The first problem not only wastes time and effort but also availability of the equipment. The second problem is more crucial as it leads to real damage with the associated collateral damage, repair and lost production.
Both problems result from the same cause. The health of a complex piece of equipment cannot be reliably judged based on the analysis of each measurement on its own. We must consider a combination of the various measurements to get a true indication of the situation.
We can combine the measurements in a structured and meaningful way by creating a mathematical model for each measurement in terms of the others. Consider the exit pressure of a compressor. This is influenced by the temperature of the medium, the rotation rate of the machine, the composition of the medium, and a few other parameters. Knowing these parameters, it is possible to calculate what the exit pressure should be. In order to actually calculate it, we need to find the relationship between all these parameters in a mathematical form.
Constructing this equation from expert knowledge is far too time-consuming to be practical given that this equation would differ for each make and model of any type of machine and also for every condition that the machine is put into. For real-life purposes, it is only worth doing it if the model can be obtained quickly and with very little human effort.
This is the domain of machine learning. These methods take empirical data that has been measured on this particular machine in the past when it was known to be healthy. From these data, the machine learning methods automatically and without human effort construct a mathematical representation of the relationships of all the parameters around the machine.
It can be proven mathematically that a neural network is capable of representing a complex data set with great accuracy as long as the network is large enough and the data consistently obeys the same laws [1, 2]. As the machine obeys the laws of nature, this assumption is easily true. We therefore use a neural network as the template for modeling each measurement on the machine in terms of the others. The machine learning algorithm finds the values for the model parameters such that the neural networks represent the data very accurately.
The selection of which measurements are important to take into consideration when modeling a particular measurement can also be done automatically. We use a combination of correlation modeling and principal component analysis to do this [1].
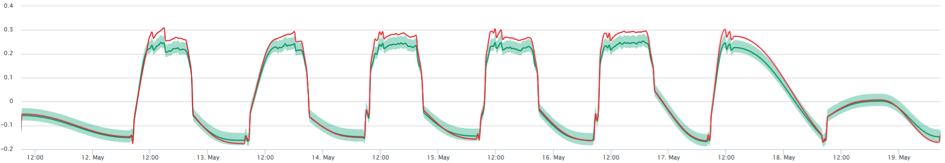
Figure 1: The displacement of the central axle of a compressor is measured (red) and modeled (green) with the confidence interval of the model (light green). It is seen that the model accurately models the behavior of the machine even during load changes, both to increased and decreased load. We observe a deviation between model and measurement at full load each time that full load is reached. This is an indication of a machine problem and will be alarmed.
The result is that each measurement on the machine gets a formula that can compute the expected value for this measurement. As the formula was trained on data known to be healthy, this formula is the definition of health for this machine. Unhealthy conditions are then considered deviations from health. See figure 1 for an illustration.
It is important to model health and look for deviations from it because health is the normal condition and much data is available for normal healthy behavior. Rather little data is available for known unhealthy behavior and this small amount is very diverse because of a host of different failure modes. Failure modes differ for each make and model of a machine making a full characterization of possible faults very complex. Modeling poor health is not a problem of data analysis but rather data availability. As such, this problem is fundamental and cannot be tackled in a practical and comprehensive way.
At any one time, we can compare the expected healthy value to the sensor value. As the expected value is computed from a model, we know the probability distribution of deviations, i.e. how likely is it that the measurement will be away from the expectation by a certain amount, see figure 2. So we may compute the probability of health from this distribution or conversely use this confidence interval in order to judge if the sensor value is too far away from health. If that is found to be the case, then an alarm is sent.
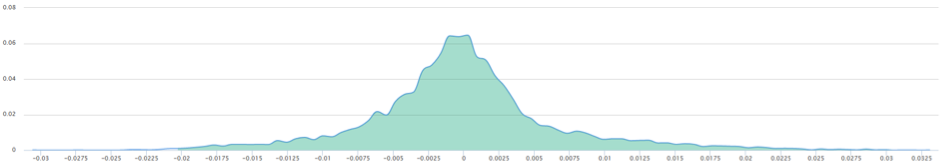
Figure 2: The deviation between model and sensor value (horizontal axis) versus the likelihood of that deviation occurring (vertical axis). We expect a bell-shaped curve for a good model, i.e. many points having little deviation and few points having a lot of deviation with an overall symmetry between deviations above and below the model. From this distribution, we can easily read off how likely any observed deviation is and thus how healthy any measured state is. This diagram directly translates a sensor measurement into a health index.
The alarm can be enriched by the information of how unhealthy the state is by providing the probability of poor health. Since the expected value has been computed from a (usually small) number of other machine parameters, it is generally possible to lay blame on some other measurement. This gives assistance to the human engineer receiving the alarm in the effort to diagnose the problem and design some action.
With normal condition monitoring, in practice, it is often found that when a machine transits from one stable state to another, lots of (false) alarms are released because a simple analysis approach cannot keep up with the quickly changing conditions. As a neural network can easily represent highly non-linear relationships, even a startup or load change of a machine will be modeled accurately without alarm if everything is as it should be.
This approach has been thoroughly tested for rotating machinery such as compressors, pumps, gas and steam turbines from several manufacturers in the operational context of power generation, chemical production, oil refining and production. Particularly the company MAN Diesel and Turbo uses this approach to alarm its compressors and gas turbines before a human engineer takes a look at the data.
Our partners have observed in practice that the total human engineering effort into setting up and maintaining a condition monitoring system decreases by over 50% due to the automated assistance of machine learning methods. This is mainly due to no longer having to carefully set the upper and lower limits for each measurement manually as now the models are generated automatically.
The incidence rate of both false alarms (false positives) and missing alarms (false negatives) have been found to be reduced by over 90%. This reduces human engineering efforts in diagnosing machine faults by over 60%, reduces maintenance budgets and improves machine availability by about 10%.
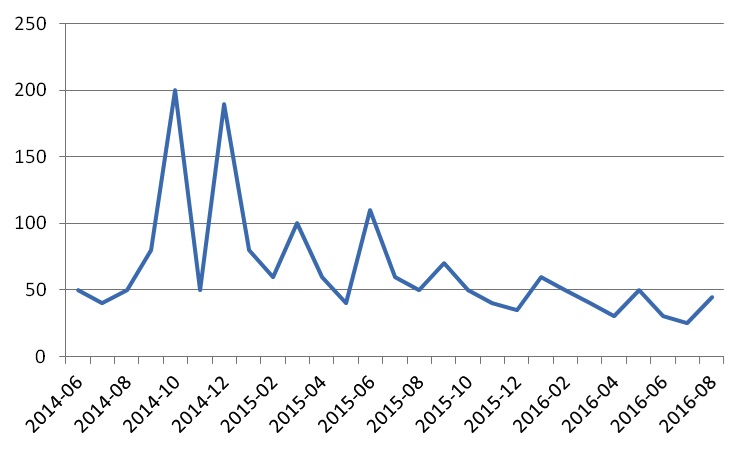
Figure 3: An example of a maintenance budget over time in thousands of US dollars. Over time, the budget size decreases as maintenance becomes less reactive and more proactive.
As the organization adopts the new methods, maintenance becomes less reactive and more proactive. This saves money in several ways. As we detect problems before they result in an unscheduled trip of the plant, any collateral damage is prevented fully. The potential lost production is reduced. The cost due to rush orders of both people and materials is also prevented. The actual issue at hand must be repaired, of course, but it can now be done in a planned, preemptive manner as opposed to a fire-fighting mode. This may reduce a maintenance budget by as much as 50%.
The two principal problems of the standard approach to condition monitoring, i.e. false alarms and bad conditions not alarmed, can be solved. This is accomplished by creating a mathematical representation of each measurement in terms of the others and thus considering the combination of various measurements around the same piece of equipment. These models can be generated automatically using machine learning without human effort. The accuracy of these models distinguishing healthy from unhealthy states is improved by an order of magnitude leading to a reduction in false alarms and missing alarms of over 90%.


