Early Warning System for Production Line Scrap


Manfred Meise
Bernd Herzog
Hella Fahrzeugkomponenten GmbH
Dr. Patrick Bangert
algorithmica technologies GmbH
A production plant makes automotive parts on a production line involving many stations. Each station performs one step in the production process. At various stages along the line, we have checking equipment that perform a variety of functional tests on each part. When a part is found to be defective, it is flagged as such and no longer treated on the stations further down the line. If a part makes it to the end of the line without a flag, it is, by definition, a good part because it has passed all testing stations.
If a part is found to be not okay, we know – thanks to the flag – the first reason encountered for it be so. Clearly no process is perfect and so we must expect some scrap parts to be produced. Of course, we would like these cases to stay at a minimum, and so we would like to be able to respond quickly if and when the production line is – for whatever reason – suddenly producing more defective parts than would normally be the case. As the data comes in from production, we would like to know, therefore, if the likelihood of producing “flagged parts” has recently increased– for whatever reason – or has not increased.
To determine this, we first collect all messages (i.e. warning signals or “flags”) identifying a part as not ok over a longer history and then divide this list into groups by the not ok code, i.e. by the reasons for which the parts were identified as scrap. Within each code group, we arrange the not-ok messages by time, and then compute the time difference between these messages. That results in a list of numbers, and we can then compute the probability distribution for these values. We compute such a distribution over two different time periods. Each time period starts from the current moment and goes back in time. One time period is longer than the other. The exact length of each depends on the respective application.
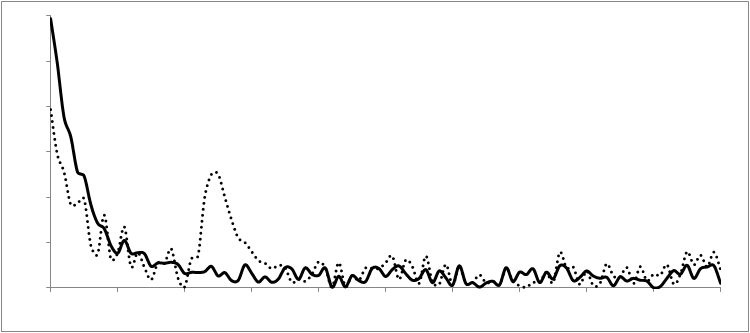
Please see figure 1 for an example of these two distributions. We see the long-term distribution plotted as the solid line and the short-term distribution plotted as the dotted line. If the behavior of the “not-ok”-producing mechanism had been the same over the recent history as over the long-term history, those two distributions should be virtually the same. However, we see a marked difference. Thus, we must conclude that the behavior has changed. In particular, we can see that the probability of errors between 20 and 30 minutes has increased substantially in recent times.

Figure 1.: The probability distribution measured over the long-term (solid line) compared to the same distribution over the short-term (dotted) reveals a difference. This difference is the bump between 20 and 30 on the horizontal axis. The horizontal axis measures the time difference between alarms in minutes. This image is for one particular type of alarm. In total, we have several hundred such plots for all types of alarms.
In order to automate this diagnosis, we need to be able to measure the difference between two distributions numerically. This is just what the chi-squared test is for. This test gives us a measure, via the chi-squared statistic itself or via its associated significance probability, of how different these distributions are. We can then introduce a cut-off for this measure. If the distributions differ by less than this cut-off, we will consider them sufficiently similar, requiring no action. If they differ by more than the cut-off value, we will signal this difference and conclude that something in the behavior of the system, with respect to this particular function test, has changed. In this case, that conclusion is provided to the operators of the production line for possible intervention.

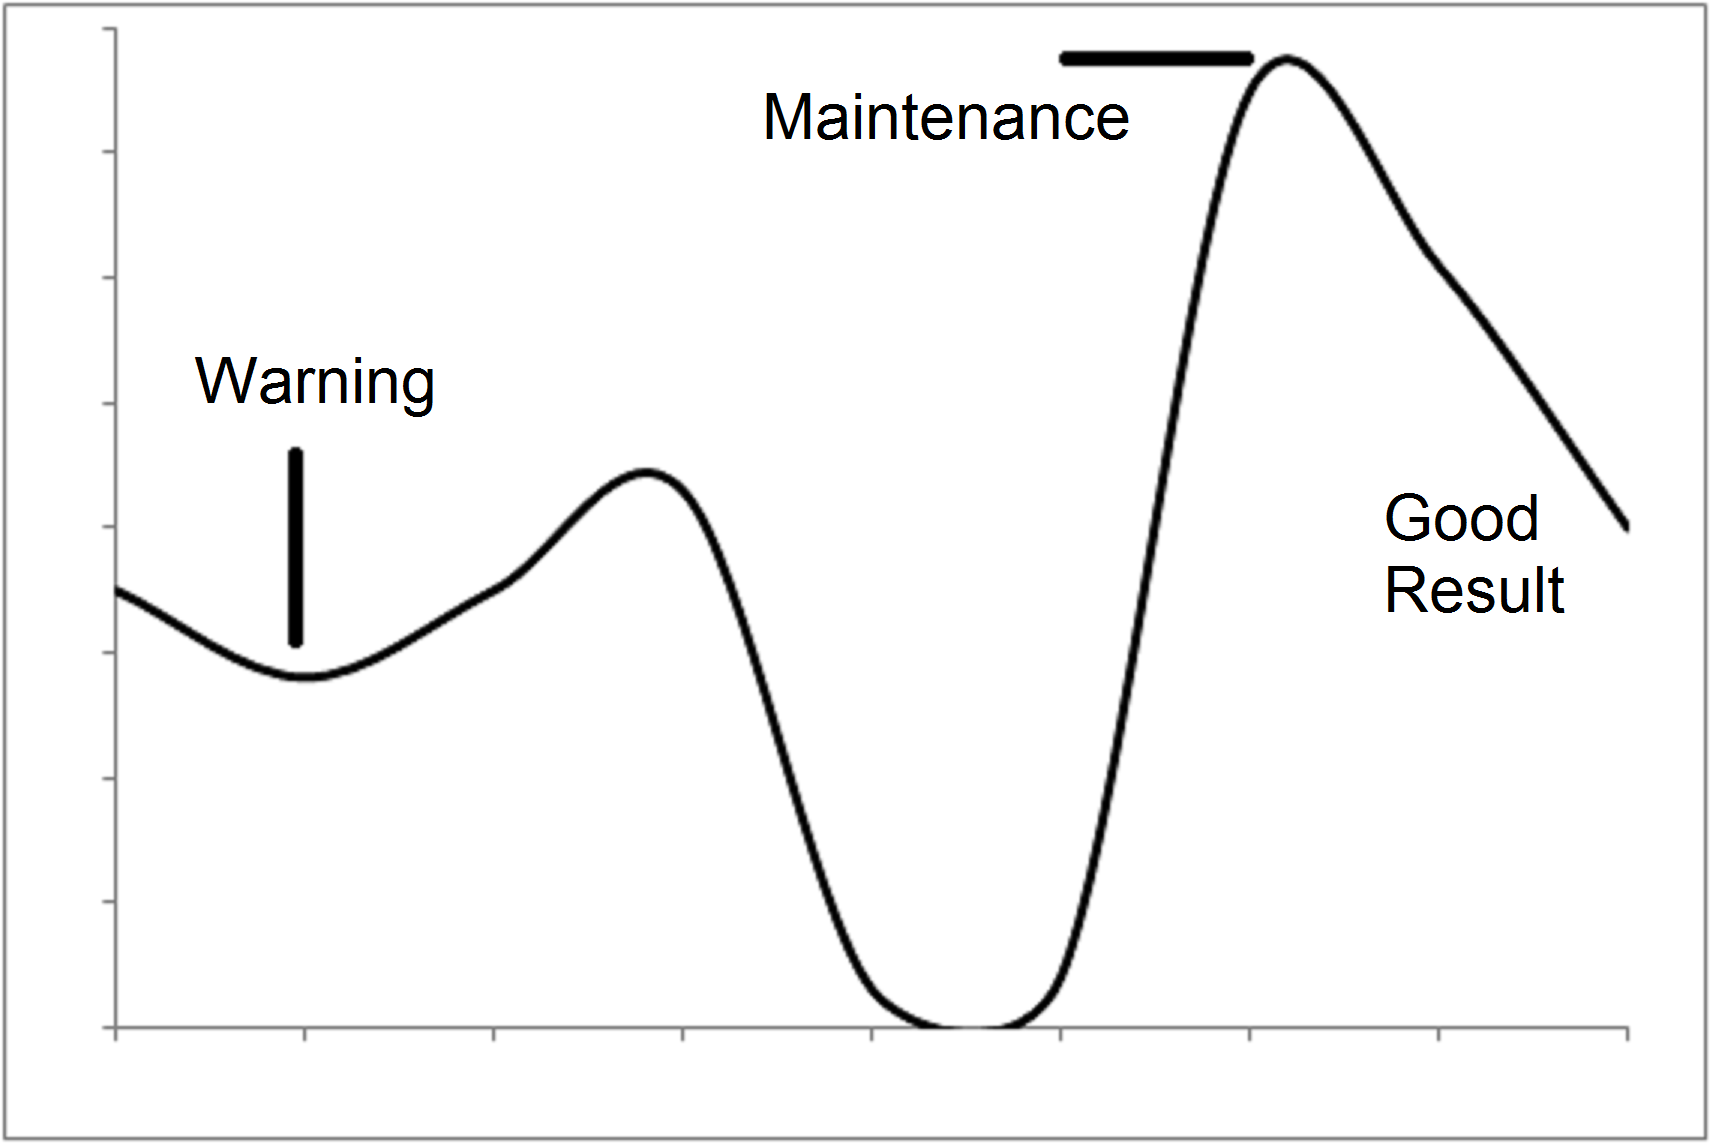
Figure 2.: The scrap rate due to the particular damage mechanism under study on the vertical axis is shown in dependence upon time (measured in days) on the horizontal axis. We see a rise in damaged parts up to day 7 if we ignore the production stop on days 5 and 6. Due to an early warning on day 2, a maintenance measure was implemented on day 7 that resulted in a drop of damaged parts on the following days. After this, the plant returned to normal levels, as e.g. on day 1.
In this way, we may filter the many alarms generated and provide the operators with useful feedback as to when these alarm signals are indeed alarming (and requiring action) and when they are simple routine background noise that can be ignored.
The sensibility in doing this achieves several ends. First, it reduces the workload of the quality control team as it lets them focus on the issues that arose from changes (i.e. their causes). Second, it highlights possible problems with the production earlier in the process, as it would otherwise have taken a very pronounced change for the human team to have picked it up.
To demonstrate the effectiveness of this approach, we present one particular case in which the analysis was helpful. One particular damage mechanism is usually responsible for approximately 0.3% of scrap, e.g. day 1 in figure 2. That is to say, if we produce 1000 parts, then 3 of these will be scrap due to this mechanism and we may or may not have further scrap parts due to other mechanisms. The plant was producing parts and the system was monitoring the scrap production of all mechanisms. On a certain day, day 2 in the figure, the system released a first warning that something was unusual with this damage mechanism. The scrap rate of this mechanism increased on the following two days. Nothing was produced on days 5 and 6 and so the scrap production was also absent. But on day 7, the scrap production due to this particular mechanism was already twice as strong as usual. The message from day 1 allowed a planned maintenance activity to take place on day 7. On days 8 and 9, the plant generated fewer scrap parts, and on day 10 the production settled back into its normal mode.
We observe from this example, that the statistical analysis of alarm signals from production yields useful facts that are considered early warning signals of an impending problem and that provide vital information that can be acted upon. Actions can therefore be planned and implemented much earlier than if we had waited until the problem had become so severe for production personnel to notice it without analysis. In conclusion, the analysis prevents the production of scrap and increases the effective output of the plant.
This project was conducted as part of the quality committee in the society Automotive Nordwest e.V. in Germany.