Catalytic Reactors in Chemistry and Petrochemistry
Dr. Patrick Bangert
algorithmica technologies GmbH
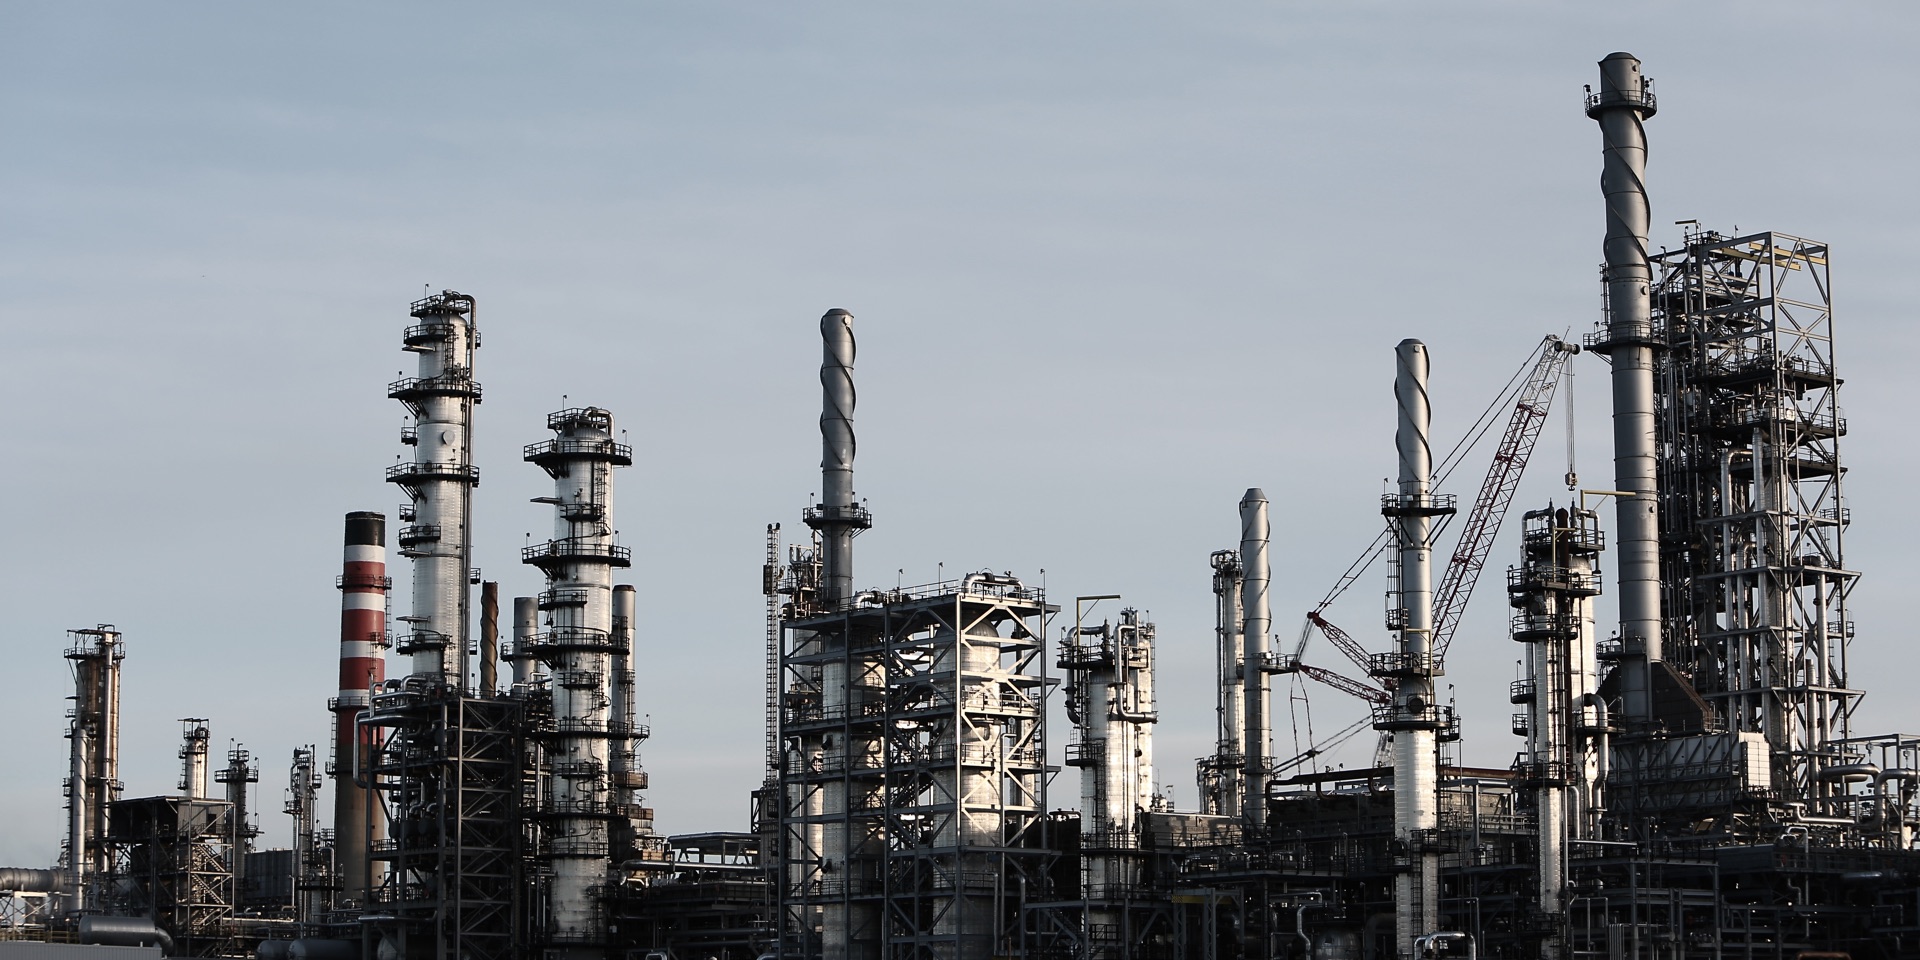
In a catalytic reactor, at least two substances are brought into contact with each other. One is a substance that we would like to change in some chemical way; and the other substance is the catalyst that is supposed to bring this change about. The two substances are mixed and heated to provide the energy for the change. It is also necessary to provide the plumbing for the substances to enter the reactor and for the end product to leave the reactor. Some parts that are not converted have to be re-cycled back for a second round (and possibly third and more rounds) through the reactor until all of the original substance has finally been transformed. One example for this process is the breaking down of the long molecular chains of crude oil in the effort to make gasoline.
As already indicated, the catalyst performs its work upon the substance and brings about a change. However, by doing so, it ages over time and thereby exhausts its potential to cause the change. This degradation of the catalyst is the primary problem in operating such a reactor continuously over the long term. The catalyst must therefore be re-activated in some fashion and at some time.
We will investigate both of the major two kinds of catalytic reactors that exist: the fluid catalytic converter (FCC) and the granular catalytic reactor (GCR). Both types of reactor require a prediction of the aging process into the future. We must know weeks in advance if and when there will be a critical deactivation.
In the FCC, the catalyst is a fluid that can be pumped into and out of the reactor. Usually, there is a loop that allows the catalyst to be pumped into the reactor in order to perform its function, and then allows it to leave the reactor into a reactivation phase only to return it back into the reactor. This loop is a non-stop feature, and the catalyst can thus be used essentially without limit. However, the speed of the loop must be carefully tuned to the actual aging of the catalyst inside the reactor so that not too much work (attempting to reactivate catalyst that is still fine) or too little work (not reactivating enough catalyst so that eventually we have too little) is invested into the reactivation job.
In the GCR, the catalyst is in the form of granules that are filled the reactor. These granules stay inside until the point is reached where the catalyst is so deactivated that the process is no longer economical. At this point, the reactor must be opened, the catalyst removed and fresh one injected. The old granules can then be sent for reactivation. Such an exchange process may require approximately four weeks of downtime which contributes substantially to the cost for the plant. Also, the new catalyst must be ordered well in advance and so the date of change must be planned beforehand.
In order to make such a prediction, we have a number of parameters that we can measure: There are several temperatures around the reactor, the inflow and outflow, a gas chromatographic identification of what is flowing out, and finally, there are a few process pressures. In fact the age of the catalyst is measured by the pressure difference across the reactor. The higher the pressure difference gets, the older the catalyst is.
Using the method of recurrent neural networks, we created a model of the GCR using almost four years of data in which the catalyst was exchanged twice (see figure 1 up to the green line). The jagged curve running over the whole plot is the measured pressure difference over the reactor. The sharp drops after which the curve again gradually rises mean that the catalyst has been exchanged; this happened three times in total in that figure. After the second catalyst exchange at time about 30,000, we made the prediction that this new catalyst would need exchanging in 416 ± 25 days. We observe from the figure that this turned out to be correct from looking at the measurement data afterwards.
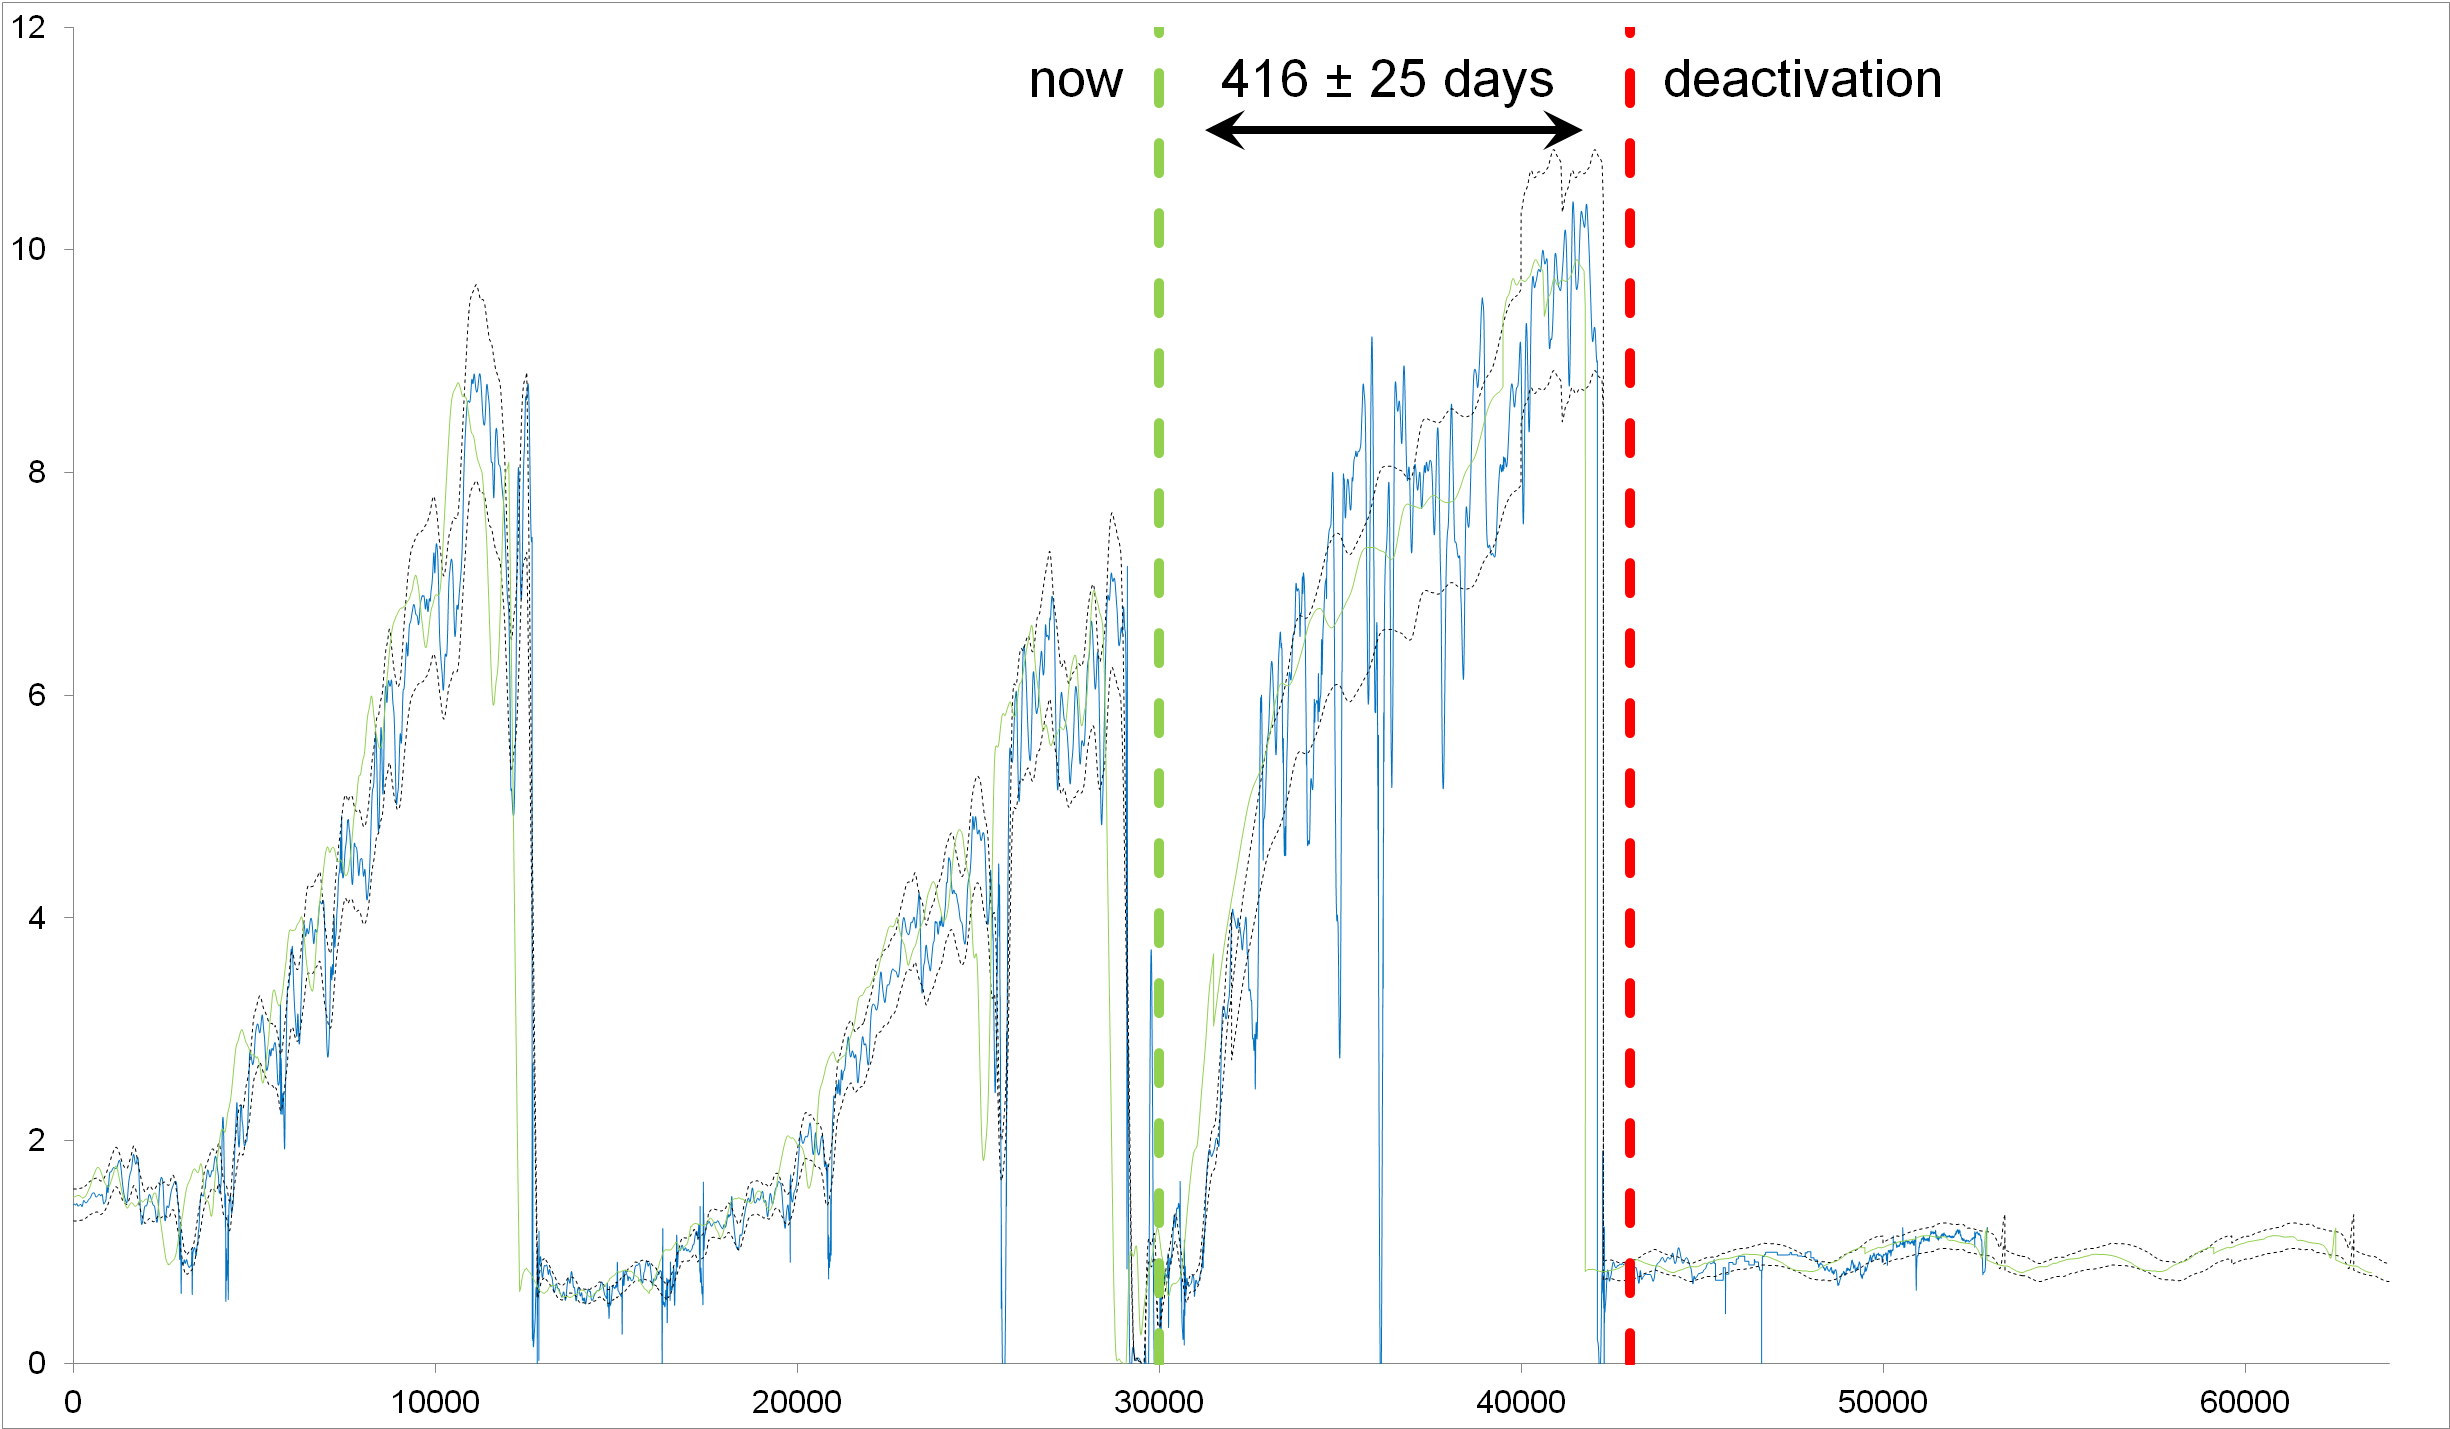
Figure 1: The pressure differential (equivalent to the catalyst age) over time. The blue line is the actual measurement and the middle smooth lines constitute the prediction. The green vertical dashed line is the present moment at which the prediction started. The red vertical dashed line is the time at which we predicted a catalyst exchange to be necessary. This prediction can be seen, using the real measurements as a control, to have been correct more than one year in advance.
On all three occasions that the catalyst was exchanged in figure 1, this happened at different differential pressures. Would it not be good to specify a single boundary value to define “too old?'' In this case, our true cut-off criterion is not a certain age but rather the point of uneconomicality of the process. As this depends on various scientific but also on various economic influences, the actual age at which the catalyst becomes uneconomical changes with fluctuating market prices. These (and their uncertainties) must be taken into account.
We now proceed to the FCC in a chemical plant, where the catalyst is a liquid. The FCC is a complex unit that has many set-points that are changed by the operating personnel to match the demands of the time. For instance the rate and manner in which the fluid catalyst is recycled is up to us to control. Set-points are the desired values for an operational measurement. For example, the operator will specify that a certain temperature should be 300°C (the set-point) while its actual value will vary a little below and above that amount depending on the efficacy of the controller. As the operators modify the set-points in dependence upon market factors, we do have some knowledge about these beforehand. Thus, we ask to what extent this prior knowledge of the set-points helps the model to predict the future state?
We investigate, in figure 2, a simple neural network model for the pressure differential (measurements are shown with dots) in dependence upon all other variables of the FCC, of which there may be several dozens,in addition to several set-points. If we only provide historical information to the model, without considering set-points, we obtain the solid curve as a prediction. Compared to the actually measured dotted curve, we can see that this model is too simplistic to be able capture reality. If we present the future data for the set-points in addition (i.e. the production plan), we obtain the dashed curve. The dashed curve is accurate and achieves our aim in predicting the correct time for reactivation (the pressure drop after time 400 hours on the plot).
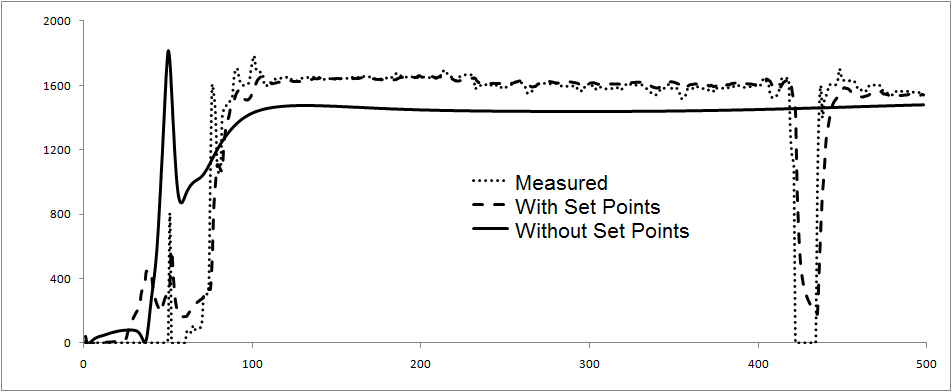
Figure 2: The pressure differential over time (in hours) on a fluid catalytic converter predicted into the future using two different models. The actual measurement is shown in the dotted line. A substantial increase in catalytic pressure is shown by an upward surge on the left of the graph. An exchange of the liquid catalysts is represented by the sharp drop on the right of the graph. A prediction using historical information only without considering some future desirable set-points(solid line) can predict the pressure increase on the left of the graph but cannot say when the catalyst ought to be exchanged. A prediction made with the knowledge of some future set-points is shown in the dashed line. The dashed line can accurately determine when a catalyst exchange ought to be made. It is clear that knowledge of future actions is beneficial.
We can thus see that the provision of some limited information about the future significantly helps the model to predict those measurements that we cannot know in advance.
In conclusion, we see that both major kinds of catalytic reactors can be modeled well. We can predict the pressure differential of both kinds of reactor into the future and thus provide information about essential future events such as the deactivation of the catalyst and thus the time (in the case of GCR) and the manner (in the case of FCC) of this deactivation. From both predictions, we easily derive the ability to plan specific actions to remedy the problem.


